Dedicated to Best Price Execution
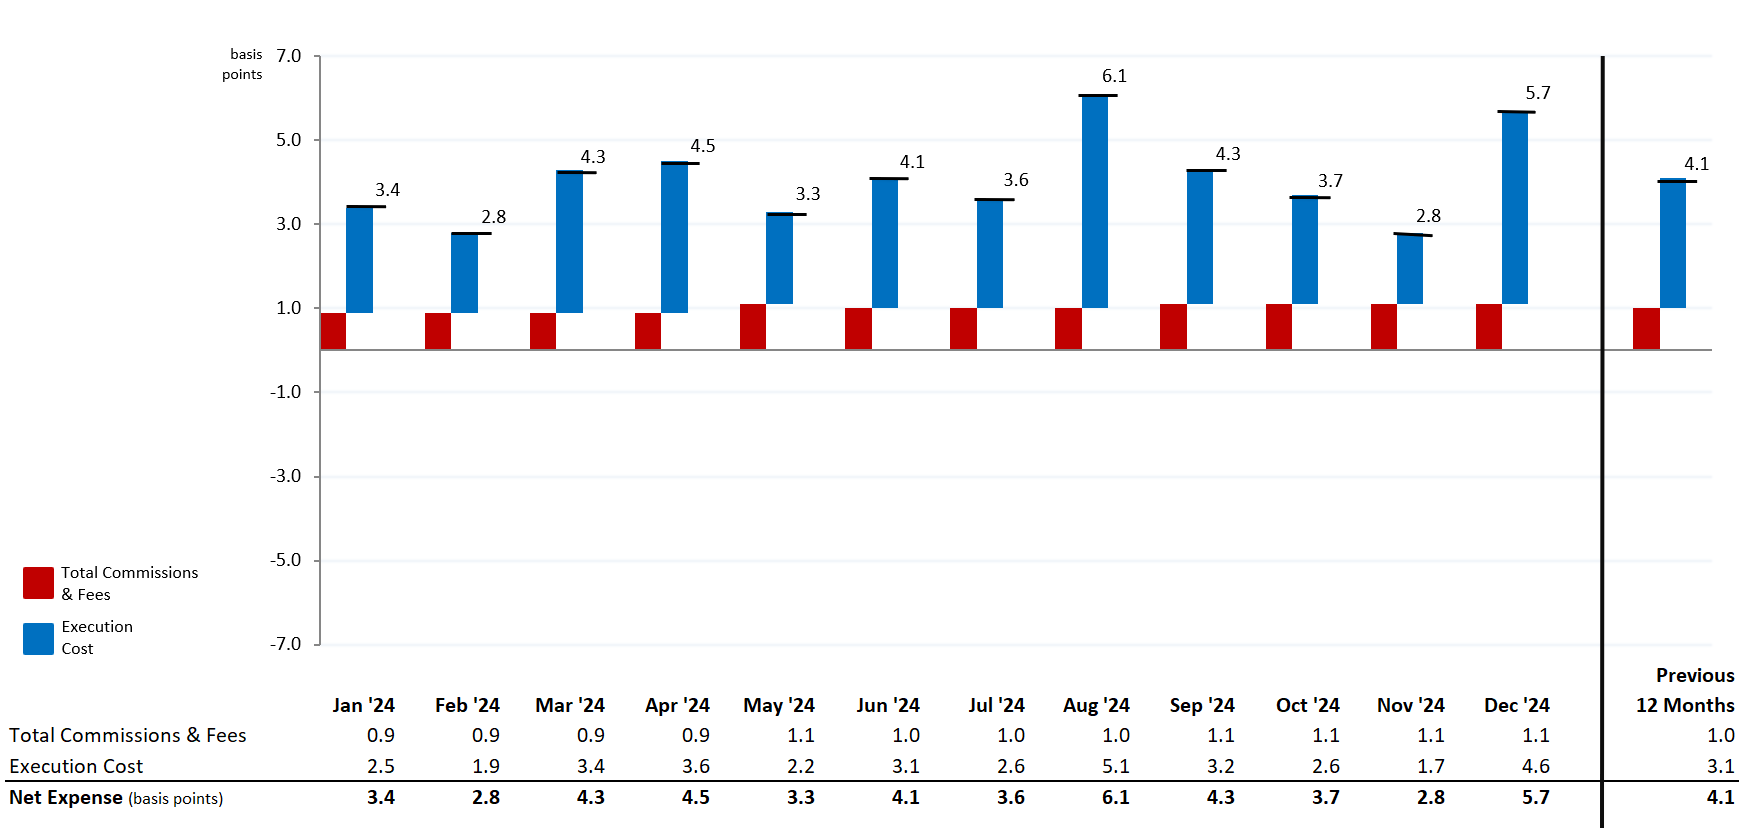
In the below statistics we propose that if all our clients' buy and sell orders were executed each day at the daily VWAP1 for each security and they paid nothing more, then their trading cost would be zero.
We compare that to the actual executions, including commissions and regulatory fees our clients paid, and calculate that for December 2024, our clients’ total trading cost was 4.1 basis points, or 0.057% of trade value.
December 2024 Trade Stats
| Total Number of Orders | Total Traded Value | Average Trade Size | Net Expense as a Percent of Trade Value |
|---|---|---|---|
| 22.98 million | $430.3 billion | $18,726* | 0.057% |
* Calculated as: Total Traded Value/Total Number of Orders ($430.3 billion/22.98 million)
IB SmartRoutingSM for IBKR Pro Clients2
IB SmartRoutingSM helps support best execution by searching for the best available prices for stocks, options and combinations across exchanges and dark pools. SmartRouting continuously evaluates changing market conditions and dynamically re-routes all or part of your order, seeking immediate electronic execution. Smart orders can only be routed to the exchanges for which clients have active trading permissions.
What Other Online Brokers Conveniently Leave Out
Our results are even more impressive when you consider that other industry-touted statistics don't give you the whole picture. They only discuss the percentage of orders that saw price improvement, and conveniently ignore the percentage of their orders that were dis-improved or had no improvement. In contrast, our statistics are netted, showing the true bottom-line price improvement including all improved, dis-improved and unimproved amounts.
- Unlike smart routers from other online brokers, IB SmartRoutingSM never routes and forgets about your order. It continuously evaluates fast changing market conditions and dynamically re-routes all or parts of your order seeking to achieve optimal execution and maximize your rebate.
- IB SmartRoutingSM represents each leg of a spread order independently and submits each leg at the best possible venue.
- IB SmartRouting AutorecoverySM re-routes your US options order in the case of an exchange malfunction, with IBKR undertaking the risk of double executions.
- To help provide price improvement on large volume and block orders and take advantage of hidden institutional order flows that may not be available at exchanges, IBKR includes eight dark pools in its SmartRouting logic.
IB SmartRoutingSM takes into account transaction costs along with the fee or rebate for taking/adding liquidity when determining where to route your marketable order when the inside market is shared by multiple exchanges. For clients who want even more control of their orders, TWS clients can specify stock and options smart routing strategies for non-marketable orders. For stocks, clients with the Cost Plus pricing structure can elect to have their non-marketable orders routed to:
- The exchange with the highest rebate.
- The listing exchange on the symbol.
- The highest volume exchange that has a rebate for adding liquidity.
- The highest volume exchange that charges the lowest fee for taking liquidity.
For options, clients can choose to send their non-marketable Smart routed orders to the exchange offering the highest rebate. These routing directives can be set on a per-order basis from the "Misc" tab of the Order Ticket, or as a global default setting from the Smart Routing configuration page.
Open an account today!
Open an AccountLearn more about why smart investors
around the world choose IBKR.
Why IBKR
Disclosures
- Consistent with the client's trading activity, the computed VWAP benchmark includes extended trading hours.
- Access to IB SmartRoutingSM for US listed securities is generally available only to IBKR Pro accounts.
